
Shooting with the Histogram
By Vidya Menon
One of the tools that really improved my photography, especially when shooting in manual mode, is the histogram. It is something I still use today to make sure I am exposing correctly. When taking photos using my old DSLR, I had the image playback set up to show the histogram alongside the thumbnail. Now using my mirrorless camera, I actually have my display set up to show the histogram in the corner of my viewfinder at all times.
What is the histogram?
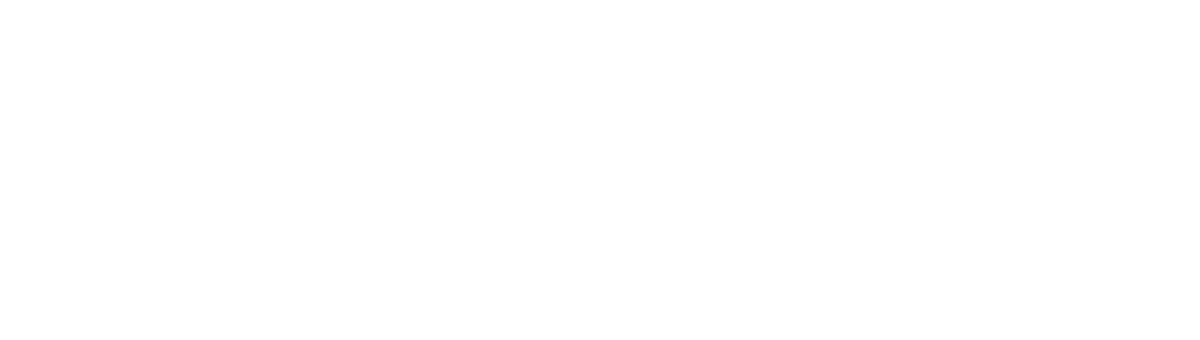
Histograms are plots that show how much light and dark tones there are in an image. The far left side of the plot represents pure black, while the far right side represents pure white. The vertical axis shows how much of each tone there is an image. In a “balanced” scene, the bulk of the tones will be in the midtones, with some small amounts of black and white. This can be seen in the image of a blackbird yelling.
The histogram can also show if an image has clipped blacks or white, i.e. the image is underexposed or overexposed to the point where data isn’t recoverable. This is seen when the histogram shows data that is fully up against the left or right edges of the plot. In these cases, the sensor is saturated and the data in those areas is nonrecoverable, even in post processing (more on this later). By checking the histogram as you’re taking photos, it’s possible to catch this issue and adjust on the fly.
In this image the Histogram is showing a relatively "balanced" scene where the bulk of the tones in the image are in the midtones.
Where the histogram proves useful
I find the histogram most useful in two scenarios: in scenes where a large part of the frame is either very light or very dark (e.g., a dark subject on a light background, or a light subject on a dark background) and in low light scenarios.
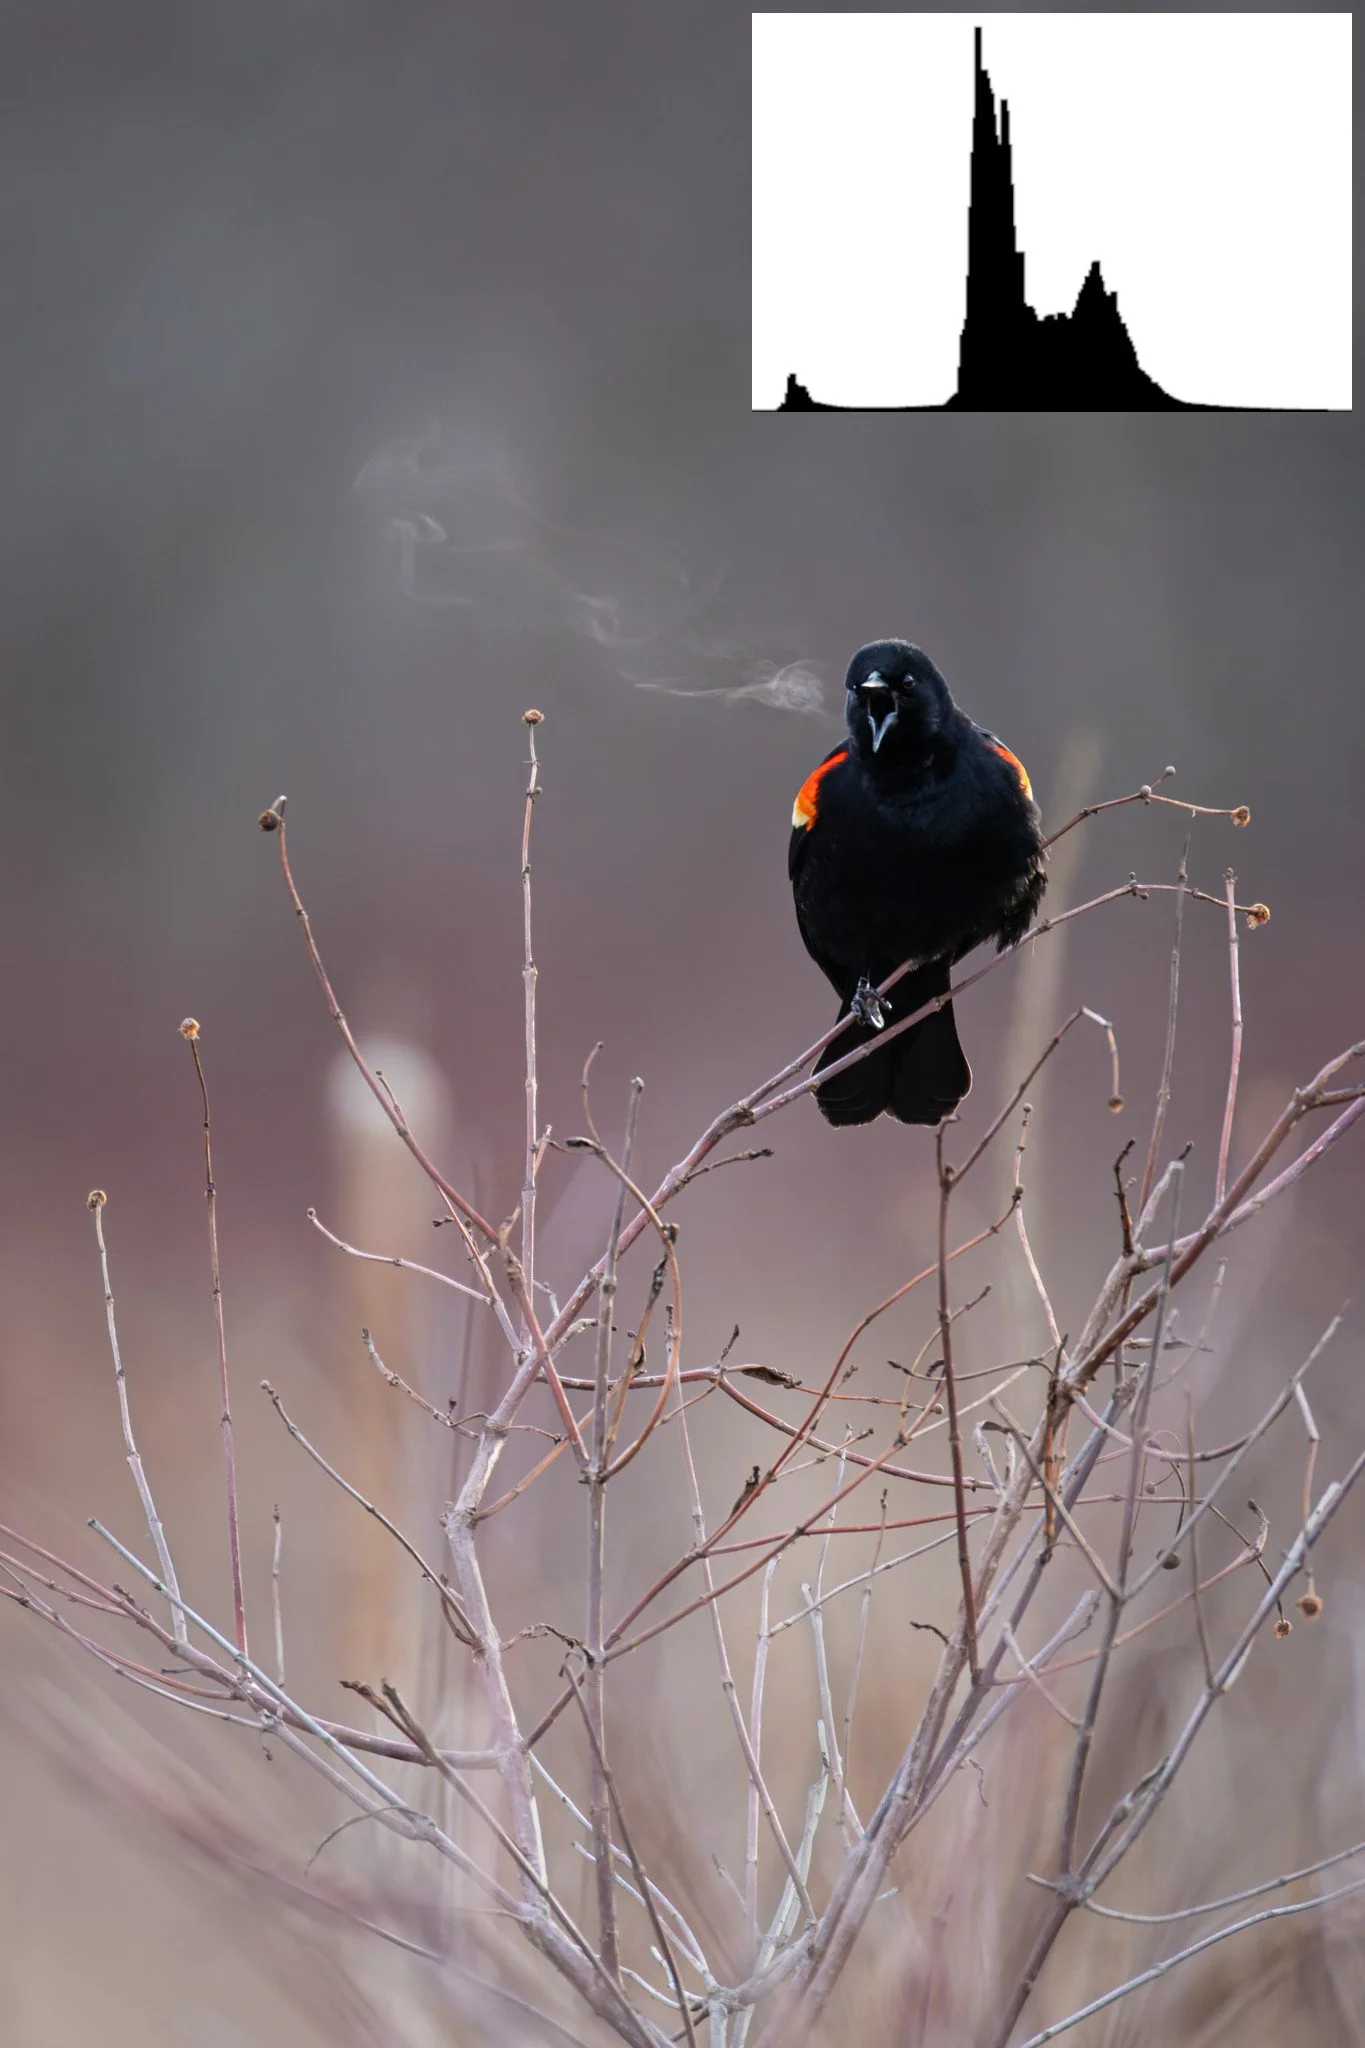
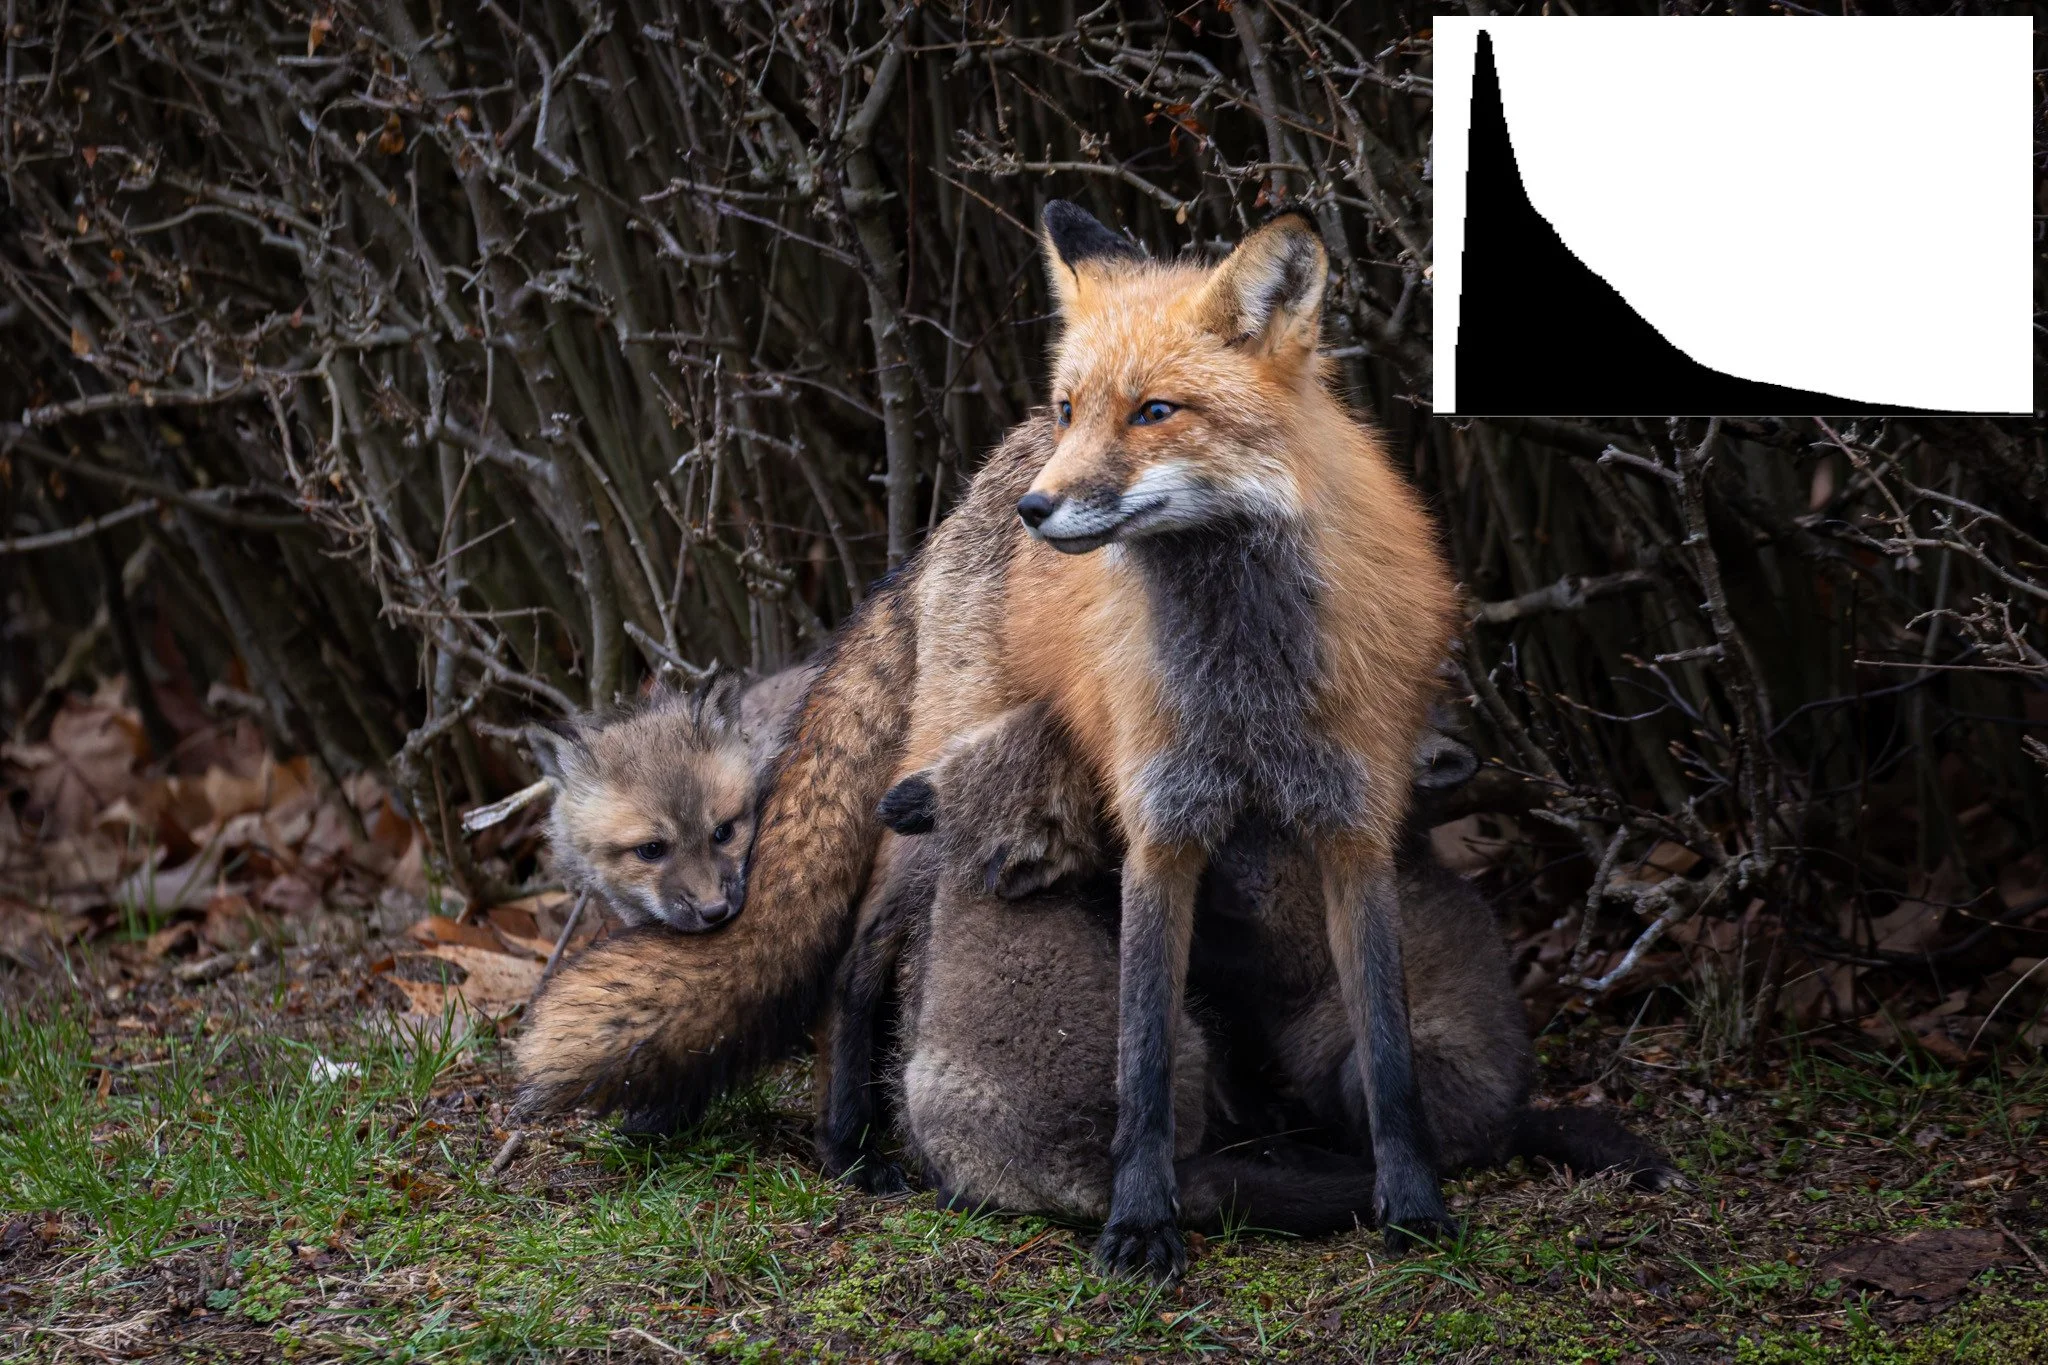
In the case when a scene has large areas of dark or light, automatic metering modes on cameras tend to struggle. When there is a light subject on a dark background (the mother fox with her kits), the camera wants to overexpose the image, and can often clip the whites in the subject. Conversely when there is a dark subject on a light background, the camera tends to underexpose (the photograph of a mourning dove). This is common in snowy scenes, when the camera meters the snow to a grey rather than white. In both these scenarios, the camera is trying to expose the image so that the bulk of the tones will fall in the midtone range when we want the histogram to be skewed to either the left or the right, reflecting the actual scene. Knowing that will be the case, by looking at the histogram you can adjust your settings (darken the image with the dark background or lighten the image with the light background) to ensure the correct exposure, without clipping your whites or blacks.
In low light scenarios, the histogram is also a useful tool for managing noise. As a wildlife photographer, I’m often photographing moving subjects at dawn or dusk where it is necessary to use a high ISO for proper exposure. With high ISOs it is extra important to expose correctly or even slightly overexpose to avoid introducing noise and degrading image quality during editing. This is sometimes called “Exposing to the Right”, because you increase the overall exposure of the image so that the histogram is skewed towards the right side. While doing so, you also want to make sure you do not clip your whites and highlights. This is because in postprocessing it is possible to lower the exposure, or darken the image, without introducing noise while the reverse is not always true. So exposing to the right allows you to minimize noise from editing. Now the caveat with this technique is that it is not as important for modern sensors in mirrorless cameras, which often have better noise characteristics than DSLRs. However, this is something I still do because it doesn’t hurt and tends to reduce how much post-processing is required. The picture of the wading bird was taken at ISO 12800 due to the low light, but because it was exposed correctly, the dynamic range and detail aren’t too bad (after denoising).
This is an example of what a histogram looks like when there is a lighter subject on a darker background.
A note about clipping in the histogram
Histograms that are shown in camera are calculated based on the JPEG thumbnail that the camera produces for previews, rather than the full raw file. What this means is that the histogram may show that the image has clipped whites or black, while the raw file will not have this issue because it contains more data than the JPEG preview. In practice, this means I will often raise the exposure in low light scenarios until my highlights are just barely clipped, because I know the raw file will not be clipped. Where this line is will be different for every camera, and learning it comes with practice.
If you’re not already familiar with the histogram, give it a try and let me know how it works for you! I would love to hear about your experiences.
This is an example of what a histogram looks like when there is a darker subject on a lighter background.
Vidya Menon is a wildlife and nature photographer based in Eastern Ontario.
This article was originally written for our private OFFBEAT Community. Join us!